
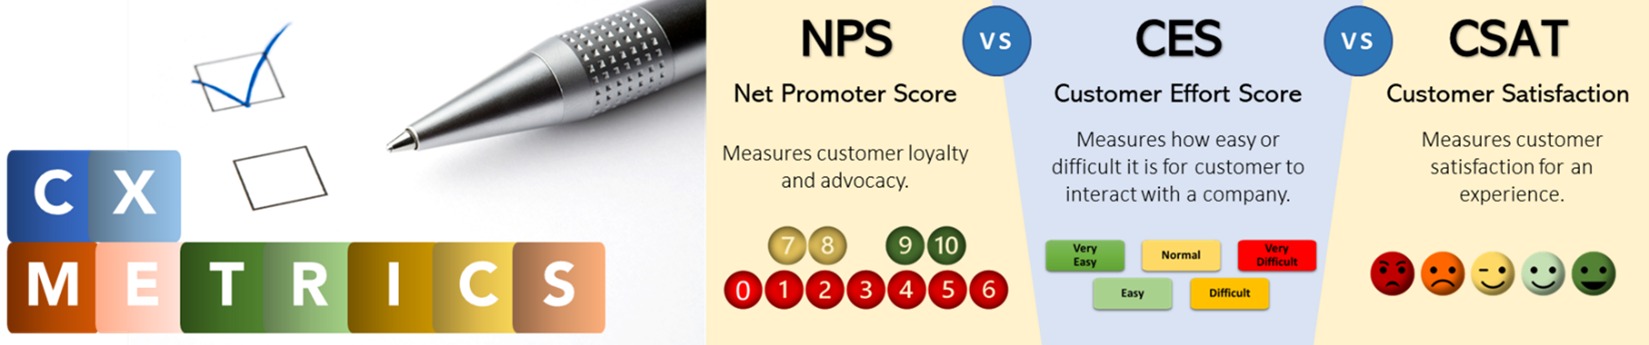
Measuring customer experience is an essential part of any customer experience program and there are several metrics that businesses can use to measure and track customer experience. This blog will explore the top three CX metrics used today by companies around the world, Net Promoter Score (NPS), Customer Effort Score (CES), and Customer Satisfaction (CSAT).
Customer Experience Metrics
Customer experience metrics are essential tools that companies use to identify where to focus on improving the customer experience, track the progress of these improvements, benchmark against competitors, and report CX information across the organization. Through analyzing the data provided by these metrics, companies can make informed decisions to improve their customer’s experience and ultimately increase customer satisfaction and loyalty. Numerous lists of metrics for measuring the customer experience can be found online. However, when looking at what is used by most companies, three metrics stand out: NPS, CES, and CSAT. Each has its own strengths and weaknesses, and the choice of which to use can depend on several factors.
Net Promoter Score
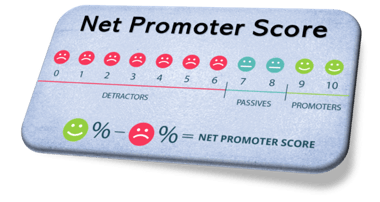 Net Promoter Score is a popular metric that measures The likelihood of a customer recommending a product or service to a friend or colleague. NPS is based on a simple question: "On a scale of 0 to 10, how likely are you to recommend our product or service to a friend or colleague?" Those who rate 9 or 10 are considered promoters, those who rate 7 or 8 are passives, and those who rate 0 to 6 are detractors.
The NPS score is calculated by subtracting the percentage of detractors from the percentage of promoters. The result can be a score between -100 and 100.
(% of Promoters minus % of Detractors) = NPS
Example: 75% - 25% = 50%
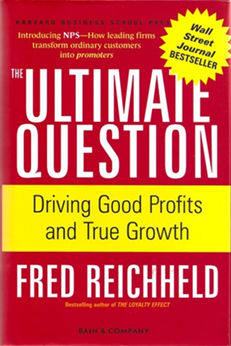 NPS was developed in the early 2000s by Fred Reichheld, along with Satmetrix and Bain & Company, to find the "Ultimate Question" that would measure customer loyalty and help predict future growth based on improving the customer experience. After much research, NPS was developed and was based on asking a loyalty question, typically "How likely are you to recommend our brand, product, service, or company to a friend or colleague?" An 11-point scale is used, along with a specific method stated above, to calculate the score. One element of NPS that many companies often overlook is the follow-up question that needs to be asked right after the primary question. The follow-up question is an open-ended question that asks, "What is the primary reason for your score?" The purpose of this second question is to identify the reasons behind the score and help businesses gather insights into how to improve their customers' experiences. Using these two questions together allows the business to identify where problems are what needs to be addressed.
As of 2020, Fortune reports that NPS is used by two-thirds of the Fortune 1000 companies to aid in understanding customer loyalty and advocacy. It is a simple metric that provides a clear picture of how customers perceive a brand. It is useful in identifying the strengths and weaknesses of a business and helps businesses make data-driven decisions regarding customer experience.
Customer Effort Score
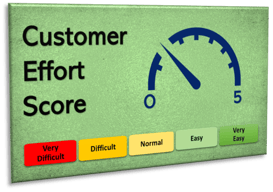 Customer Effort Score is a metric that measures The ease of a customer's experience with a product or service or in other words, How easy it is to do business with your company. With CES, customers are asked how easy or difficult it was to complete a task such as purchasing a product, resolving an issue, or navigating a website. CES typically employs a 5 or 7 scale. The original method for conducting CES was to ask users how much effort to complete a task or resolve an issue.
Today it is more common to ask how easy or difficult it was to complete a task or resolve an issue. With this method, 1 would represent “very difficult” and 5 “very easy”. Customers are asked “On a scale of 1 -5 where 1 is very difficult and 5 is very easy, how easy it was to resolve your issue”. The higher the score, the easier it was for the customer to complete their task.
(Total of all scores divided by the total survey responses) multiplied by 100 = CES
Example: 700 / 1000 x 100 = 70%
In 2010, Harvard Business Review published an article titled Stop Trying to Delight Your Customers, which was based on research from the Customer Contact Council, a division of the Corporate Executive Board. The study involved over 75,000 customers and found that attempting to delight customers did not necessarily build loyalty. Instead, by reducing the effort required by customers and making the experience easier, customer loyalty could be increased. Additionally, the study found that by reducing the effort required, the cost of customer service could be lowered while improving the overall customer service experience.
CES is a crucial metric that helps businesses understand how easy or difficult it is for customers to interact and do business with them. With the example shown above, a high CES score indicates that customers find it easy to do business with the brand, while a low score indicates that there are significant barriers to completing a task. By measuring CES, businesses can identify the pain points in the customer journey and take steps to eliminate them.
Like with NPS, businesses should ask an open-ended follow up question to gain insight as to why the customer found it easy or difficult. This will direct the company to where they need to focus to make the customer experience easier.
Customer Satisfaction

Customer Satisfaction is a metric that measures The satisfaction of a customer with a product, service, or interaction. Customers are usually asked to rate their satisfaction on a scale that can range from a 3, 5, 7, 10, and even 11-point scale (the 11-point scale is often used to be consistent with the NPS scale). A high CSAT score shows customers are happy with their experience, while a low score indicates problems must be addressed.
The CSAT is typically generated by taking the number of satisfied customers (4s & 5s on a 1-5 scale) and dividing that number by the number of survey responses. Then multiplying by 100 to obtain the percentage of satisfied customers.
(All satisfied responses divided by the total survey responses) multiplied by 100 = CSAT
Example: 200 (4’s and 5s) / 300 x 100 = 66%
CSAT is the oldest CX metric of these three and is a flexible metric that allows you to ask a range of questions about a single interaction or touchpoint, such as a customer support call or a purchase experience. It can help you understand how a customer feels about a specific experience, but often does not present a complete picture of the customer's overall satisfaction with the brand or company.
Which metric to use?
Each of these metrics has its proper place within a CX program. Which one to use depends on what you are trying to measure and what data is needed to achieve the goal of improving the customer experience. NPS is the best metric for measuring customer loyalty and advocacy, while CES is most effective for measuring the ease or difficulty of the customer experience, and CSAT for measuring customer satisfaction for any interaction.
Each of these three metrics complement each other and should be used in conjunction with each other, and with other business KPIs (key performance indicators) such as customer churn rate, retention rate, first call resolution, average call length, upsell rates, etc.
Can a single metric tell the whole story?
My first encounter with CSAT (customer satisfaction) and NPS (Net Promoter Score) was when Sony implemented NPS in their service organization. The service group had been using CSAT for a long time to measure customer satisfaction for both customer support and repair services. The CSAT score was consistently in the upper eighties and low nineties, indicating customers were satisfied with the services provided.
However, when Net Promoter Score was added to the surveys, the initial NPS score was significantly lower than the CSAT score. This indicated that there were areas where the customers were not completely satisfied, and that they were not likely to recommend the services to others. As a result, improvement activities were implemented across the customer support and repair departments to address the areas of concern.
As a result, the NPS score increased dramatically over time, while the CSAT score remained unchanged. This demonstrated that NPS provided a better indication and guide for improving the customer experience, as it looked beyond just customer satisfaction and presented a deeper understanding of what was causing poor customer experiences.
In the article What Effortless Office Learned When They Went From CSAT to Account Experience, author “Ian Luck” details a similar experience that Leif Cederblom from Effortless Office had when they began to use NPS after years of only using CSAT scores. He writes that
“Effortless Office had a respectable CSAT of 98.4, but it was not telling the right story to management. After only four months and two relational surveys, they are already seeing huge results. When they moved to sending relational NPS surveys, the respondents were no longer rating a single transaction with customer service–they were rating the overall experience with the company.”
Using more than one metric
It is important to note that while each of these metrics has its unique strengths, using only one metric will not provide a complete picture of the customer experience. For example, a customer might give a high NPS score, but still find it difficult to navigate the website or too complicated to find an answer using an automated solution. Businesses should use a combination of metrics to obtain a comprehensive understanding of their customers' experiences.
When determining which metric(s) to use, several factors should be considered. What is the purpose of the metric? Are you trying to measure a specific point along the customer journey with a short transactional survey, or are you looking to analyze the overall customer relationship using a longer relational survey? What insights are you trying to gather? For example, are you trying to measure customer loyalty, satisfaction with a particular product or service, or the ease of the purchasing process? Each of these insights requires different metrics, so it is important to be clear on what you are looking for before choosing a metric.
By using multiple metrics with your CX program you will gain a more comprehensive view of the experiences across the entire customer journey and yield the greatest results for driving improvements across the company, increasing customer retention and loyalty. Click here to see an example of a telephone survey where multiple questions and metrics are utilized.
 One important thing to note is that while multiple metrics is key collecting the insights to drive change, when it comes to presenting this information across the company, a single metric is more effective for this task. Presenting multiple metrics can be confusing and overwhelming for those who may not be as familiar with the nuances of each metric. Using a single metric like NPS simplifies the communication process and ensures everyone can easily understand the results and track progress of the CX program results.
Conclusion
All these metrics are important in measuring the success of a business's customer experience efforts. It is important to choose the right metric for the right situation and to consistently track and analyze the results to improve customer experience.
CX metrics should not be used in isolation but used in conjunction with other business metrics to gain a full understanding of the customer experience and its impact on the business and its goals.
But remember, these metrics will do nothing by themselves; you must analyze the data behind the metric and act on the insights to improve the customer's experience.
Let us know what metrics you use and how you use them within your customer experience program.


Leave a Comment